Reading a phase portrait
Most introductions to the damped oscillator hand you a single wiggly curve of position against time and move on. That curve is true, but it's one story out of infinitely many — one choice of where the mass started. The phase portrait shows all of them at once.
State, not time
Instead of plotting x against time, plot velocity
v against position x. Each point is a complete
state of the system. The differential equation assigns every point a
direction — a little arrow saying "if you're here, you go there next."
Together those arrows form a vector field, and any actual motion is just
a curve that follows the arrows.
See it move
Here's the same simulation from the lab. Drag inside the plot to pick a starting state, and change the damping to move between the regimes:
- trajectory
- initial state
- equilibrium
- vector field
The arrows show the flow of the system at every point; the bright curve is the path traced from the chosen start. Underdamped (0 < ζ < 1) spirals inward to rest; critical and overdamped (ζ ≥ 1) decay straight in; ζ = 0 orbits forever.
Why the spiral
With light damping the arrows circulate and point gently inward, so trajectories wind around the origin while losing radius — a spiral sink. Crank the damping past critical and the circulation disappears: every path slides straight in. Remove damping entirely and the arrows form perfect closed loops, so the state orbits forever.
A phase portrait trades one exact answer for the shape of every answer.
That trade is the whole reason to simulate: intuition about "the shape of every answer" is exactly what a wall of algebra tends to hide.
Take the maths with you
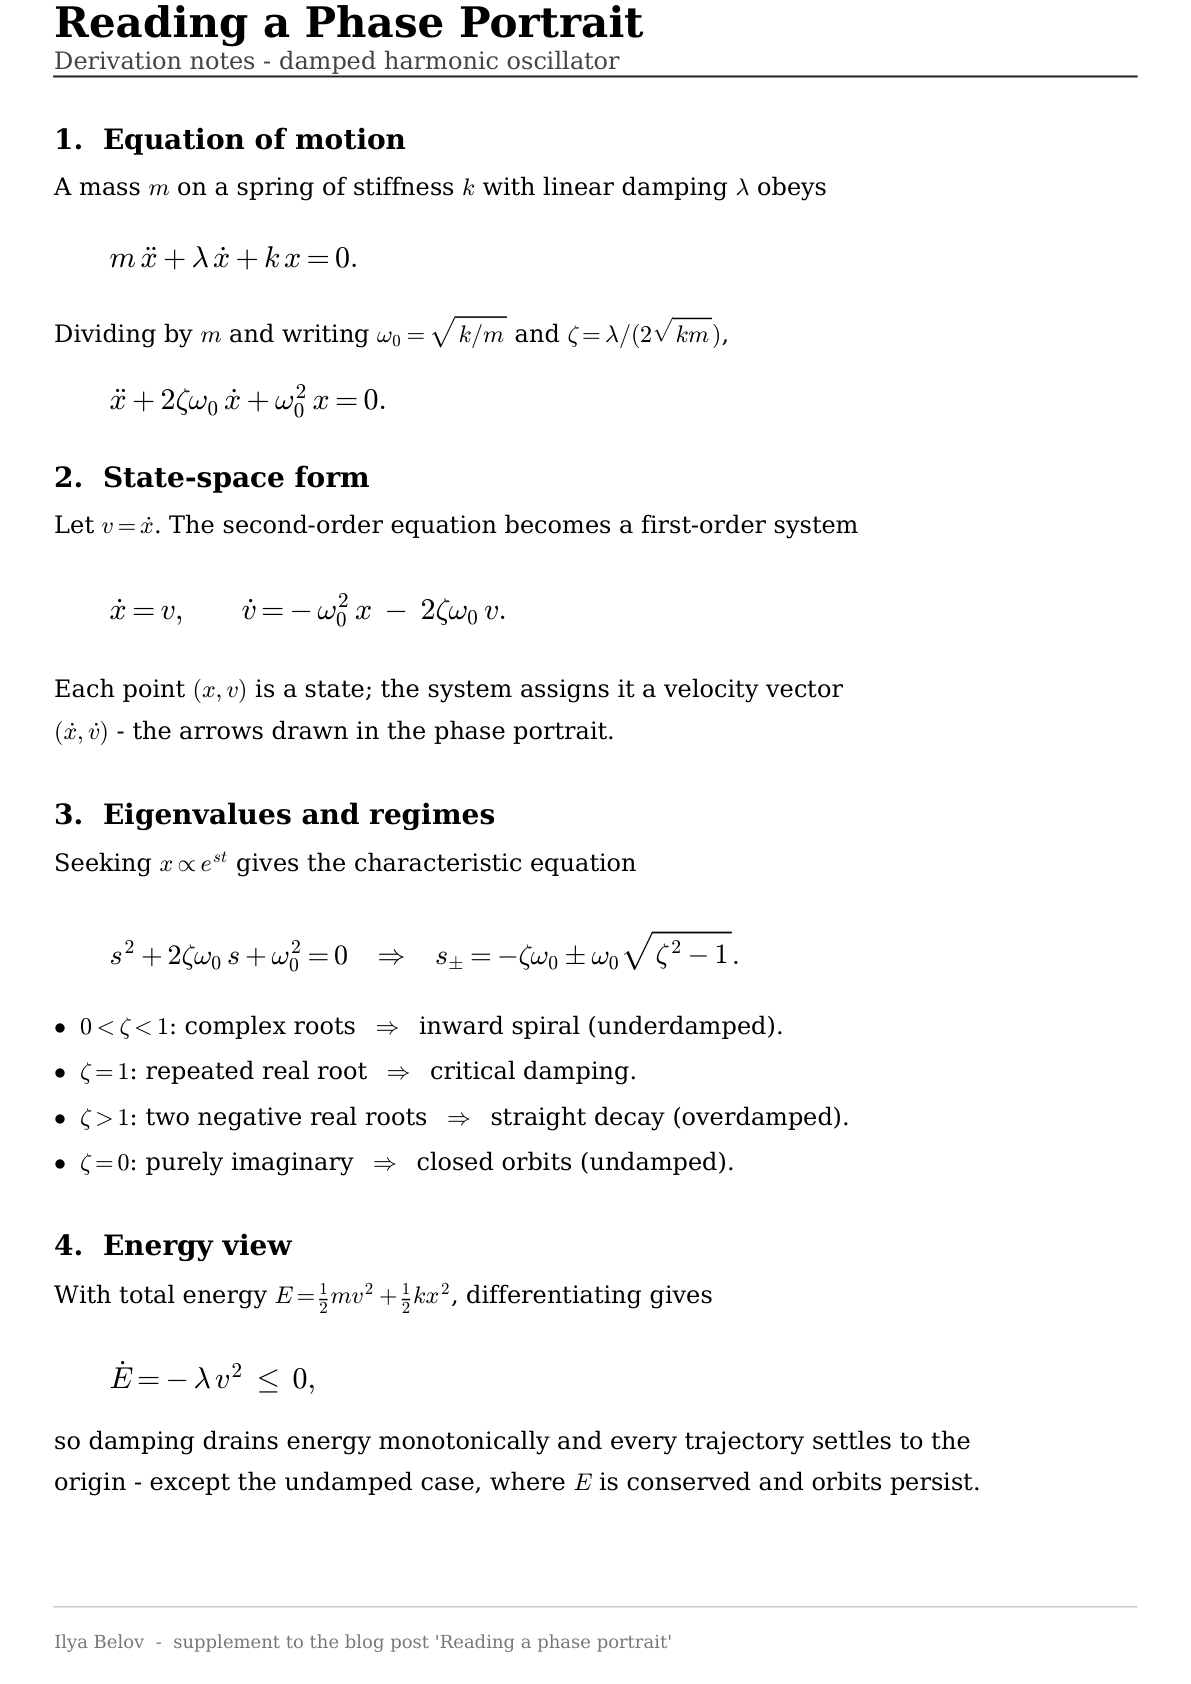
If you want the algebra in full — the equation of motion, the state-space form, the eigenvalues, and the energy argument — I wrote it up on a single page. Preview it below, or download the PDF.
 PDF
PDF Damped oscillator — full derivation
One page: equation of motion, state-space form, the three damping regimes from the eigenvalues, and the energy view.